Earth Science worksheet
    Topic: Seasons
    Seasons
    1

    Flash flooding is most likely to occur when heavy rain falls on

    (1) deforested landscapes with clay soils

    (2) deforested landscapes with sandy soils

    (3) forested landscapes with clay soils

    (4) forested landscapes with sandy soils

    Base your answers to questions 2 on the passage and map below and on your knowledge of Earth science. The map shows a portion of Southeast Asia.

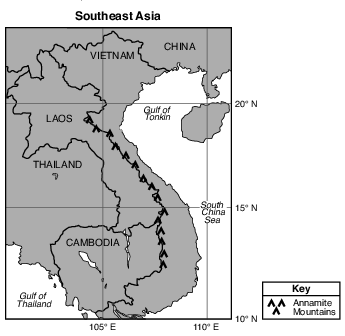
    Southeast Asia Monsoons

    The Southeast Asia monsoons are seasonal shifts in the direction of regional planetary winds. These shifts are related to the movement of air pressure belts as the Sun’s vertical ray changes latitude. In the late spring, winds begin to blow from the southwest, bringing moisture from the Gulf of Thailand across Southeast Asia. Rainfall reaches a peak in July and August. This moisture is partially blocked by the Annamite Mountains, located along the border between Vietnam and Laos. Therefore, the rainfall in central Vietnam is somewhat less during these months. In September, the winds reverse direction and begin to flow from the northeast across the Gulf of Tonkin and South China Sea. This wind shift begins the season of heavy rainfall in central Vietnam that continues for months.

    seasons-and-astronomy, seasons, standard-6-interconnectedness, systems-thinking fig: esci-v202-exam_g32.png

    2

    Heavy rains occur in Cambodia and Thailand when the moist air brought by the monsoon

    (1) rises, expands, and cools

    (2) rises, contracts, and warms

    (3) sinks, expands, and cools

    (4) sinks, contracts, and warms

    3

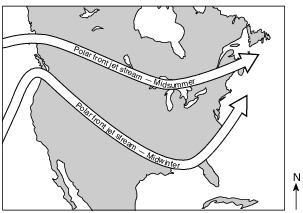
    The map below shows two seasonal positions of the polar front jet stream over North America.

    meteorology, transfer-of-heat-energy, seasons-and-astronomy, seasons, meteorology, front, meteorology, jet-streams, standard-6-interconnectedness, patterns-of-change fig: esci12012-examw_g13.png

    Which statement best explains why the position of the polar front jet stream varies with the seasons?

    (1) Rising air compresses and cools in winter.

    (2) Water heats and cools more rapidly than land in winter.

    (3) Prevailing winds reverse direction in summer.

    (4) The vertical rays of the Sun shift north of the equator in summer.

    4

    The winds shift from southwest to northwest as heavy rains and hail begin to fall in Albany, New York. These changes are most likely caused by the arrival of

    (1) an mT air mass

    (2) a cT air mass

    (3) a cold front

    (4) a warm front

    5

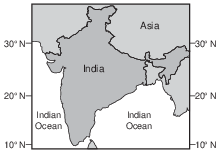
    The map below shows the location of India and the Indian Ocean.

    seasons-and-astronomy, seasons, standard-1-math-and-science-inquery, geocentric-model-heliocentric-model, standard-6-interconnectedness, models fig: esci12016-examw_g5.png

    Which statement best describes the monsoon winds during the rainy season in India?

    (1) Warm, moist air flows from India to the Indian Ocean.

    (2) Warm, moist air flows from the Indian Ocean to India.

    (3) Cold, dry air flows from India to the Indian Ocean.

    (4) Cold, dry air flows from the Indian Ocean to India.

    Base your answers to questions 6 on the maps below and on your knowledge of Earth science. The maps show a portion of India and Southeast Asia, bordering on the Indian Ocean, during the winter and summer monsoon seasons. Large areas of high and low air pressure are shown during each season.

    reference-tables, key-to-weather-map-symbols, meteorology, presentation-of-weather-data, meteorology, air-mass, standard-1-math-and-science-inquery, changing-length-of-a-shadow-based-on-the-motion-of-the-sun, standard-6-interconnectedness, models fig: esci12018-examw_g33.png

    6

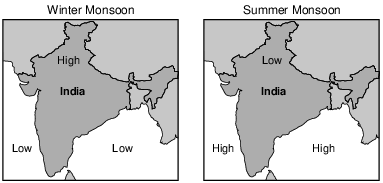
    The heavy monsoon rains affecting India and Southeast Asia occur during

    (1) winter, when winds blow from the land

    (2) winter, when winds blow toward the high pressure

    (3) summer, when winds blow from the ocean

    (4) summer, when winds blow toward the high pressure

    7

    The map below shows a typical position and average velocity of the polar front jet stream during two different seasons.

    meteorology, transfer-of-heat-energy, seasons-and-astronomy, seasons, meteorology, weather-basics-and-observable-patterns, meteorology, front, meteorology, jet-streams fig: esci62012-exam_w_g3.png

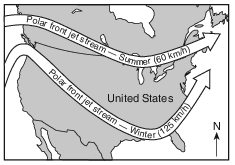
    For the eastern United States, the change of the polar front jet stream from this summer position to this winter position causes

    (1) warmer temperatures farther north and causes storms to move more slowly

    (2) warmer temperatures farther north and causes storms to move more rapidly

    (3) cooler temperatures farther south and causes storms to move more slowly

    (4) cooler temperatures farther south and causes storms to move more rapidly

    8

    Monsoons develop as a result of

    (1) large changes between the temperatures of a continent and neighboring oceans

    (2) a continent and neighboring oceans having nearly the same temperatures

    (3) air rising over Earth’s equatorial region

    (4) air sinking over Earth’s polar regions

    9

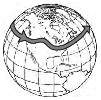
    The map below shows location X in northern India.

    seasons-and-astronomy, seasons, standard-1-math-and-science-inquery, geocentric-model-heliocentric-model, standard-6-interconnectedness, models, standard-6-interconnectedness, patterns-of-change fig: esci62017-exampwr_g7.png

    Summer monsoon rains normally occur in India when

    (1) high pressure exists near location X, pulling moisture in from the Indian Ocean

    (2) high pressure exists near location X, pushing moisture out to the Indian Ocean

    (3) low pressure exists near location X, pulling moisture in from the Indian Ocean

    (4) low pressure exists near location X, pushing moisture out to the Indian Ocean

    10

    Which diagram best represents the general position and direction of flow of the polar front jet stream in the Northern Hemisphere during the winter months?

    (1) reference-tables, planetary-wind-and-moisture-belts-in-the-troposphere, meteorology, transfer-of-heat-energy, seasons-and-astronomy, seasons, meteorology, weather-basics-and-observable-patterns, meteorology, front, meteorology, jet-streams, standard-1-math-and-science-inquery, changing-length-of-a-shadow-based-on-the-motion-of-the-sun, standard-6-interconnectedness, models fig: esci62018-examw_g2.png

    (2) reference-tables, planetary-wind-and-moisture-belts-in-the-troposphere, meteorology, transfer-of-heat-energy, seasons-and-astronomy, seasons, meteorology, weather-basics-and-observable-patterns, meteorology, front, meteorology, jet-streams, standard-1-math-and-science-inquery, changing-length-of-a-shadow-based-on-the-motion-of-the-sun, standard-6-interconnectedness, models fig: esci62018-examw_g3.png

    (3) reference-tables, planetary-wind-and-moisture-belts-in-the-troposphere, meteorology, transfer-of-heat-energy, seasons-and-astronomy, seasons, meteorology, weather-basics-and-observable-patterns, meteorology, front, meteorology, jet-streams, standard-1-math-and-science-inquery, changing-length-of-a-shadow-based-on-the-motion-of-the-sun, standard-6-interconnectedness, models fig: esci62018-examw_g4.png

    (4) reference-tables, planetary-wind-and-moisture-belts-in-the-troposphere, meteorology, transfer-of-heat-energy, seasons-and-astronomy, seasons, meteorology, weather-basics-and-observable-patterns, meteorology, front, meteorology, jet-streams, standard-1-math-and-science-inquery, changing-length-of-a-shadow-based-on-the-motion-of-the-sun, standard-6-interconnectedness, models fig: esci62018-examw_g5.png

    Base your answers to questions 11 on the diagram in image provided, which shows Earth as viewed from space on December 21. Some latitudes are labeled.
    11

    State one factor, other than the tilt of Earth’s axis, that causes seasons to change on Earth. [1]

    Allow 1 credit. Acceptable responses include, but are not limited to:

    • — parallelism of Earth’s axis

    • — The North Pole always points toward Polaris.

    • — revolution of Earth

    • — location of the Sun’s vertical ray

    • — duration/intensity of insolation

    • — angle of insolation

    Base your answers to questions 12 on the diagram below and on your knowledge of Earth science. The diagram represents a side view of Earth. The North Pole and some latitudes are labeled. The dashed line represents Earth’s axis.

    seasons-and-astronomy, motion-of-objects-in-the-solar-system, seasons-and-astronomy, seasons, standard-6-interconnectedness, models, standard-6-interconnectedness, patterns-of-change fig: esci12020-examw_g37.png

    12

    Identify the season that is just beginning in the Northern Hemisphere when Earth is in this position. [1]

    Allow 1 credit for summer.

    Base your answers to questions 13 on the diagram below. The diagram represents daytime and nighttime on Earth. Point X is a location on Earth’s surface. Earth’s rotational surface velocity is shown in miles per hour (mi/h) at specific latitudes.

    seasons-and-astronomy, earth-rotation, standard-6-interconnectedness, models fig: esci62012-exam_w_g59.png

    13

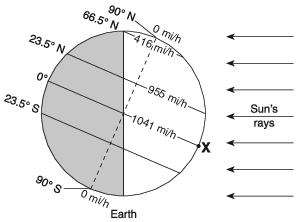
    Identify the Northern Hemisphere season that is just beginning when Earth is at the position represented in this diagram. [1]

    Allow 1 credit for summer.

    Base your answers to questions 14 on the diagram in image provided and on your knowledge of Earth science. The diagram represents a model of Earth’s orbit around the Sun. Arrows represent two motions of Earth. Distances from the center of the Sun to the center of Earth are indicated in kilometers. Earth is represented when it is closest to the Sun and when it is farthest from the Sun.
    14

    On the diagram in the image provided, place an X on Earth’s orbit at one location where Earth’s Northern Hemisphere is in winter. [1]

    seasons-and-astronomy, motion-of-objects-in-the-solar-system, seasons-and-astronomy, seasons, standard-6-interconnectedness, systems-thinking, standard-6-interconnectedness, models fig: esci82014-ansbkt_abkq5.png

    Allow 1 credit if the center of the X is within or touching the clear banded region shown below.

    • Note: Allow credit if a symbol other than an X is used.

    • It is recommended that an overlay of the same scale as the student answer sheet be used to ensure reliability in rating.

    seasons-and-astronomy, motion-of-objects-in-the-solar-system, seasons-and-astronomy, seasons, standard-6-interconnectedness, systems-thinking, standard-6-interconnectedness, models fig: esci82014-rg_g4.png

    Base your answers to questions 15 on the diagram below and on your knowledge of Earth science. In the diagram, letters A, B, C, and D represent Earth’s location on the first day of the four seasons as it orbits the Sun. Aphelion (Earth’s farthest distance from the Sun) and perihelion (Earth’s closest distance to the Sun) are labeled to show the approximate positions where they occur in Earth’s orbit. The dashed lines represent Earth’s axis, and the North Pole is labeled N.

    seasons-and-astronomy, earth-revolution, standard-6-interconnectedness, models fig: esci82018-examw_g46.png

    15

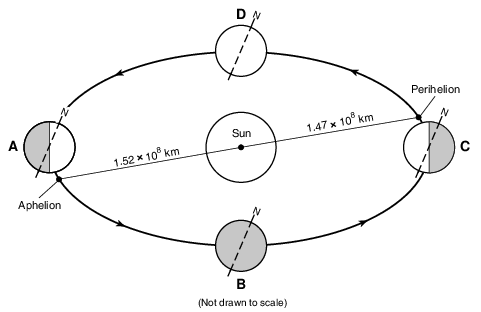
    Identify the season in New York State during which Earth is at perihelion. [1]

    Allow 1 credit for winter.